Note: To watch analytics audience overview report live Live Guided Tour Click.
Date Range
The first dimension of the analytics report is the date range. By selecting this dimension, you can easily get analytics reports of different times.


Date Range Selector
This is usually a calendar where you can select different date ranges. When you make changes to this date range, the report view changes immediately. You can also get the report by selecting last week, last day, last month by clicking on the drop down of date range.


Date Range Comparison
If you want, you can compare your selected time with any given time. In this case you have to select the “compare to” option and you can compare the date range in different dimensions. This is very important because it lets you know if your business has changed over time.


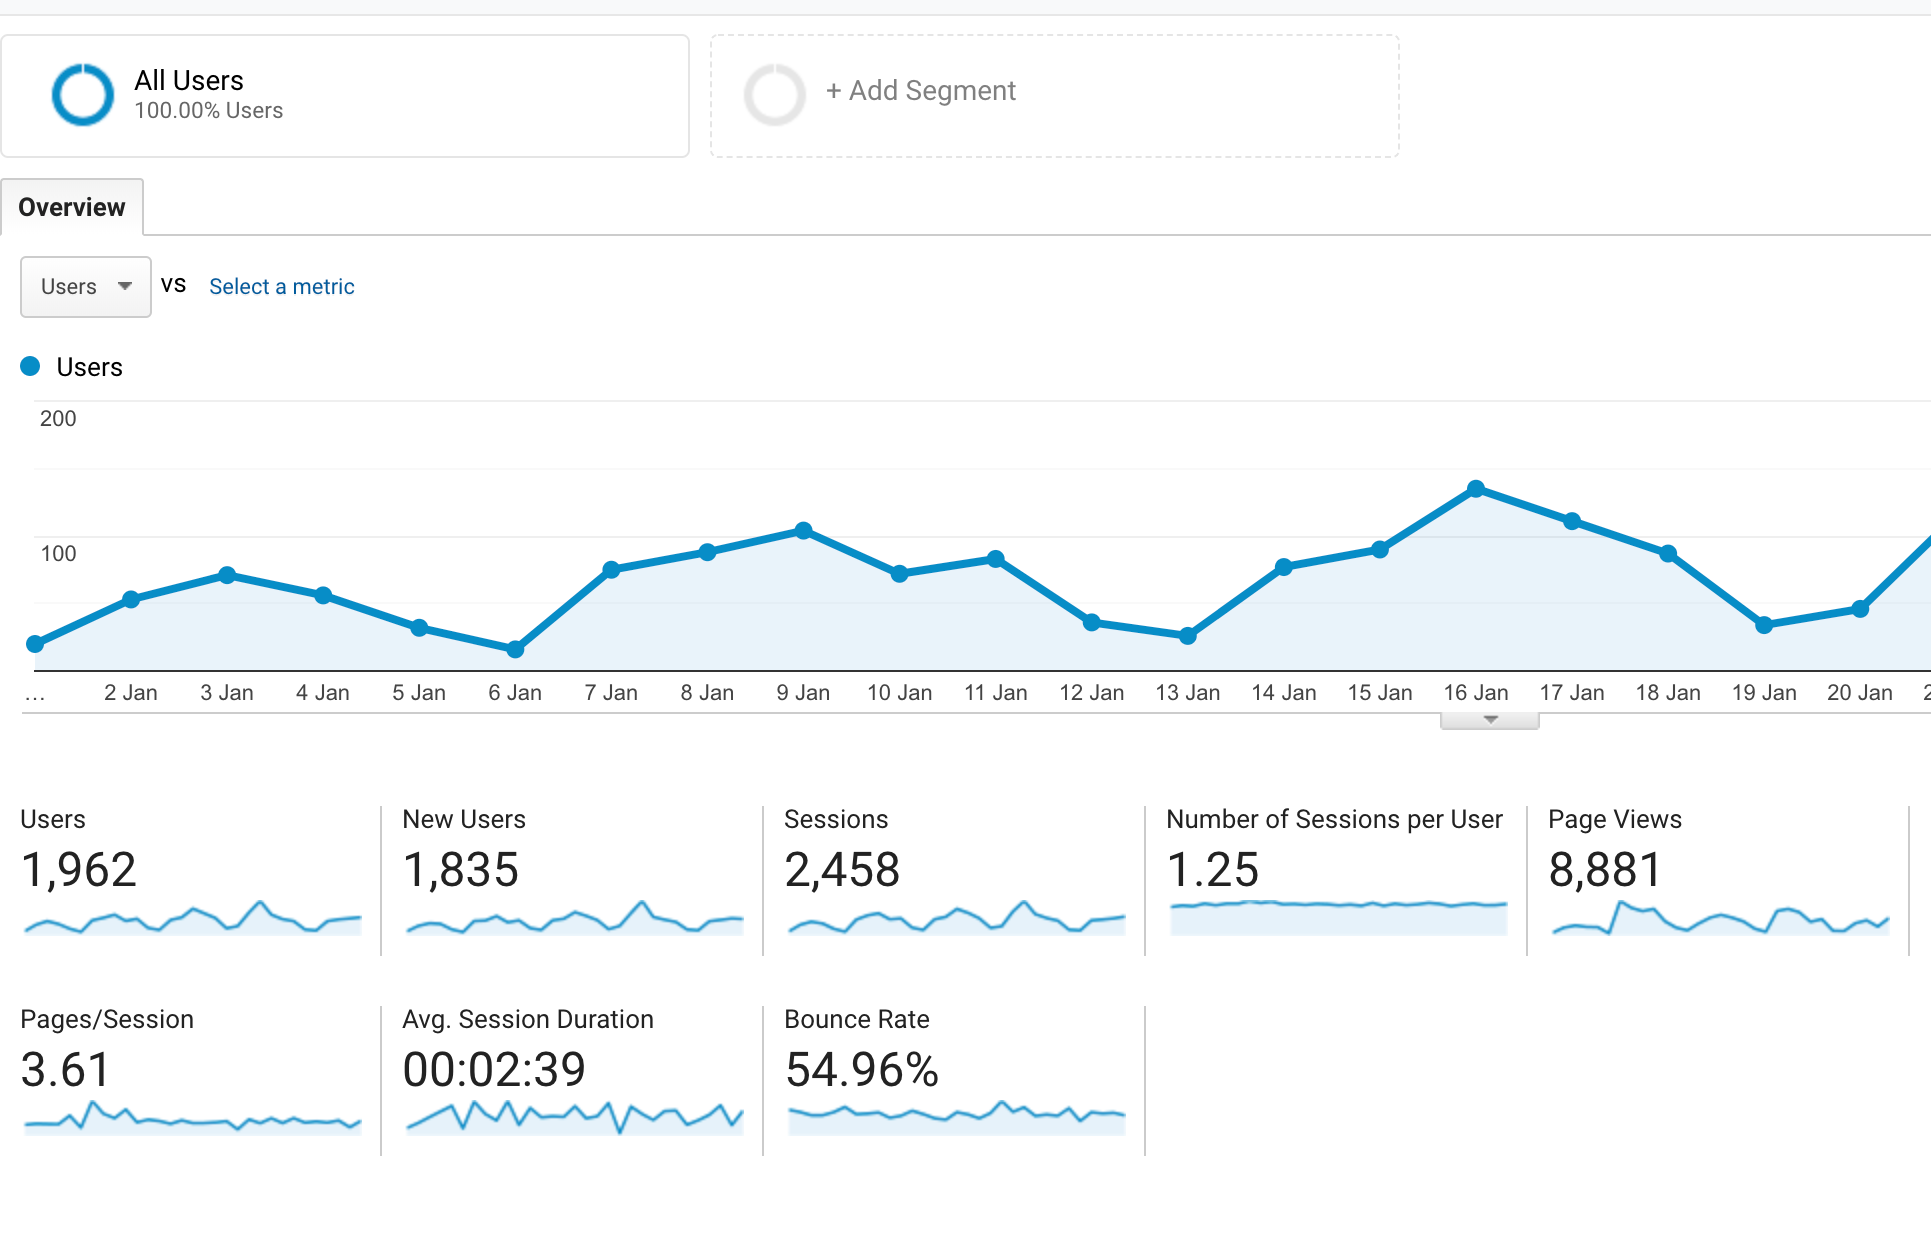
Line Graph
Line graph is a very important data set in analytics reports, where by default you will see the number of site users per day in the selected date range.


Duration Selector
You can make the data view more specific if you want. For example, on an hourly basis, or on a monthly or annual basis, this view is very useful when you do long-term data analysis.


Metric Selector
From the dropdown menu in the Overview tab you can see other metrics instead of user metrics in the line graph and here you will also have the option to compare 2nd with another metric and there is a chance to look at different date ranges.


Metrics
Many shot metrics are displayed below the line graph. We will now try to find out about the metrics.


Sessions Is the total number of sessions in your selected date range.
Users Is the total number of site users in the selected date range.
Page Views) Is the total number of visited pages in the selected date range, usually the Analytics tracking code calculates the page views as soon as the page is loaded. If a user visits the same page again and again, the views of each visit will be added.
Pages Per Session) Is the number of pages visited in a session.
Average Session Duration Is the average length of each session within the selected date range.
Bounce Rate Here is the percentage of users who visited your site who visited the site with only one page and did not visit any other page.
New vs. Returning User
This pie chart shows the percentage of new and returning visitors.


Dimensions and Metrics
The lowest part of the overview report contains a number of useful dimensions, such as demographics, systems and mobile. The metrics under each dimension display 10 data sets and provide a full report when you click on View Full Report.


Learn more:
[★★] You too can open a Fulcrumy account and post about science and technology! Become a great technician! Click here Create a new account.
Join Facebook!